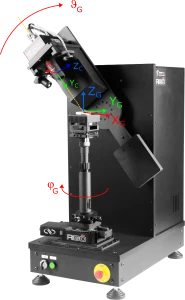
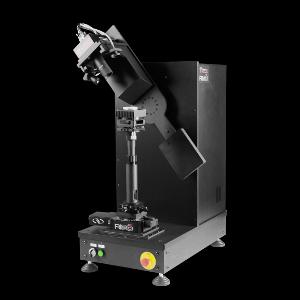
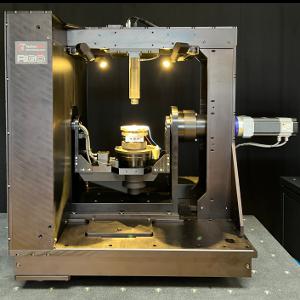
Goniophotometer RiGO801-LED
Measurement of Ray Data of an LED Using the Goniophotometer RiGO801-LED
Application Note - AN2002
This page provides a concise summary of the Application Note on measuring ray data using the RiGO801-LED goniophotometer with a white LED. It details the setup and execution of the measurement and concludes with an overview of the results.
Measurement Principle
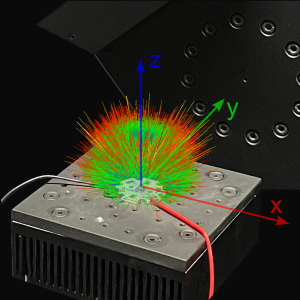
All RiGO801 goniophotometers utilize the near-field measurement principle, where the LMK 6-5 luminance measurement camera (ILMD, see [2]) moves around the light source to capture the spatial luminance distribution. This distribution is then converted into ray data (ray file, ray set) and the luminous intensity distribution (LID) (see [3], [4], [5], [6], [7]).
Ray data, also commonly referred to as ray files, consist of vectors with associated luminous flux components. A sufficiently large number of rays accurately represents the emission characteristics of a light source. They are frequently used for realistic simulation of optical components.
Mounting the LED on the Test Fixture
The LED is mounted on the goniophotometer's test fixture. The fixture includes a heat sink (75 mm x 75 mm) with a threaded grid plate, a fan, and a leveling unit. The heat sink ensures stable thermal conditions, with the fan activated as needed.
The LED should be mounted on a circuit board with mounting holes. For proper alignment and measurement in the goniometer, viewing angles must remain unobstructed, meaning no shadowing elements should be present. In this note, a LED on a star board is used, which can be easily screwed onto the fixture.
The connecting wires are routed to the terminal block. For stable operation, constant current is recommended. The current can deviate from the LED's nominal parameters but should ensure stable performance.
The test fixture is mounted on the telescopic axis, with height and rotation roughly pre-adjusted.
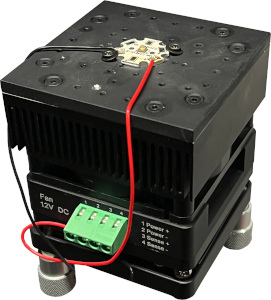
LED auf Messfassung
Aligning the LED in the Goniometer Coordinate System
The Theta and Phi axes of the goniophotometer define a spherical coordinate system linked to a Cartesian coordinate system. Ray data are output within this system, making it essential to document and precisely align the LED. Using the Measurement - Align Measuring Object function, the LED can be accurately positioned. A dialog displays the camera image with the coordinate system and provides controls for the goniometer axes. The camera is aligned along the Cartesian axes to capture images for positioning and leveling.
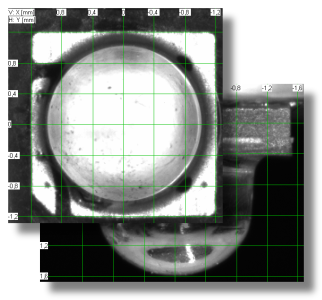
Camera Images with Coordinate System for Alignment
The horizontal alignment is performed using the X/Y adjustment unit of the telescopic axis. Height and rotation are adjusted by moving the telescopic tube, while leveling is done with the integrated leveling unit of the test fixture.
Key Positioning Guidelines:
- The center of the light-emitting area or volume should be positioned as centrally as possible due to the lens's limited depth of field.
- Rotation and leveling of the LED should be based on clearly identifiable edges or contours.
- Alignment features should match datasheet drawings or CAD data to precisely determine the position of the coordinate center.
Setting Up the Measurement
The measurement program then guides the user step by step through various dialogs to configure the settings and input details for the measurement.
Angular Range and Resolutions
The angular range should cover the relevant emission area. Typically, this includes ±90°, but many LEDs, like in this case, emit over a larger range. Beyond 90°, higher luminance levels occur, which, although secondary emissions, are crucial for realistic emission characterization. Here, ±100° was chosen, as shading from the circuit board or fixture occurs beyond this point. An elevated mounting position would have been beneficial but was not applied in this test measurement.
The angular resolutions of the goniometer axes are typically 0.5° or 0.75°, enabling precise sampling. Thanks to on-the-fly measurement, the duration remains relatively short at about 1.5 to 2 hours.
Camera settings
The camera settings include integration (exposure) time, ND filter, and, for filter wheel cameras, the filter position (here, the V(λ) filter). The integration time is set at the position of maximum luminance using a maximum scan. To achieve an optimal dynamic range, the utilization should be around 90%, which was achieved here with 10 ms.
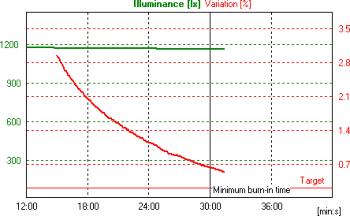
Monitoring of Stabilization Phase
Setting the Start Procedure
The light source must be stable before starting the measurement. Two start options are available:
- Delay Time: A fixed interval before the measurement starts..
- Automatic Stability Monitoring: Following CIE S 025 [8] or IES LM-79-19 [9], the illuminance is monitored, and the measurement starts automatically once the stability threshold (recommended: 0.2% for LEDs) is reached.
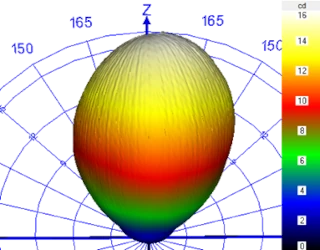
LID 3D View
Measurement Results
The measurement results are provided in two files:
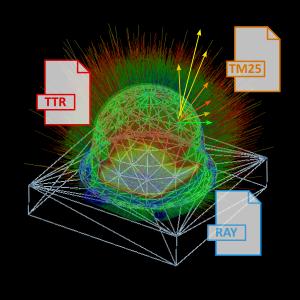
- TTL File: ASCII INI format containing the luminous intensity distribution, measurement details, and parameters. Export formats include IES LM-63 [10], EULUMDAT, and ASCII. Further information can be found in the measurement and software manuals.
- TTR File: Contains ray data, additional data, and TTL content. Post-processing is supported by the free TechnoTeam Converter801 software, which exports ray data into formats such as IES TM-25 [11], ASAP, Speos, LightTools, LucidShape, Zemax, and TracePro.
Für die Strahlengenerierung sind spezifische Einstellungen erforderlich, die in der TTR-Datei gespeichert werden können, um externe Nutzung ohne Zusatzkenntnisse zu ermöglichen. Details dazu werden in einer separaten Application Note erläutert.
Download
References
| [1] | TechnoTeam Bildverarbeitung GmbH, „RiGO801 Measurement Software“, https://www.technoteam.de/products/goniophotometer_rigo801/rigo801_software/rigo801_measuring_software/index_eng.html. |
| [2] | CIE 244:2021: "Characterization of Imaging Luminance Measurement Devices (ILMDs),“ CIE, 2021. |
| [3] | CIE 070-1987: „The Measurement of Absolute Luminous Intensity Distributions,“ CIE, 1987. |
| [4] | R. Poschmann, M. Riemann und F. Schmidt, „Verfahren und Anordnung zur Messung der Lichtstärkeverteilung von Leuchten und Lampen“. DE Patent 41 10 574, 30 March 1991. |
| [5] | M. Riemann und F. P. R. Schmidt, „Zur Bestimmung der Lichtstärkeverteilung von Leuchten innerhalb der fotometrischen Grenzentfernung mittels eines bildauflösenden Goniofotometers,“ LICHT, Nr. 7-8, pp. 592 - 596, 1993. |
| [6] | I. Ashdown, „Near-Field Photometric Method and Apparatus“. USA Patent 5,253,036, 12 October 1993. |
| [7] | I. Ashdown, "Near-field photometry: a new approach," J. Illuminating Engineering, vol. 22, pp. 163-180, 1993. |
| [8] |
CIE S 025:2015: "Test Method for LED Lamps, LED Luminaires and LED Modules", CIE, 2015 |
| [9] |
IES LM-79-19: "Optical and Electrical Measurements of Solid State Lighting Products", Illuminating Engineering Society, 2019. |
| [10] | IES LM-63-19: "IES Standard File Format for the Electronic Transfer of Photometric Data and Related Information", Illuminating Engineering Society, 2019. |
| [11] | TechnoTeam Bildverarbeitung GmbH, „Software Manual Converter801“, https://www.technoteam.de/products/goniophotometer_rigo801/rigo801_software/converter_801/index_eng.html |
| [12] | IES TM-25: "Ray File Format for Description of the Emission Properties of Light Sources", Illuminating Engineering Society, 2020 |
